Reporting and Charting Enhancements in Web Connect
The new version of Web-Connect for Prophet 21® offers the ability to customize the charting components on Sales Rep and Customer Dashboards.The latest release of Web-Connect for Prophet 21® provides some new reporting functionality that may not be obvious at first. One of these new features is the ability to change the appearance of the dashboard charts.
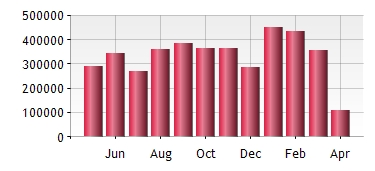
By default, the charts on the dashboards for Sales Reps, Customers and Admins is in the form of a columnar chart:
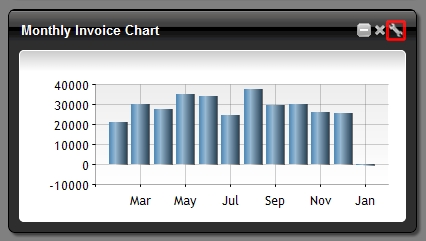
Web Connect offers several customization options for the chart. These options can be found by clicking on the “edit” button on the chart:
This will open the Web Connect Web Part editor as shown below:
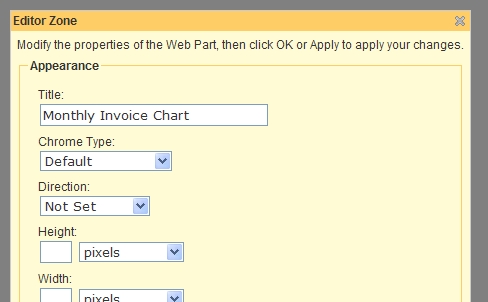
There are several properties here that you can adjust including the Title of the control etc. These properties are broken down into three main categories:
- Appearance
- Layout
- Custom Properties
The Custom Properties section has been set up to allow the user to define the following items for charts:
- Chart Height
- Chart Width
- Chart Type
- Area
- Column
- Doghnut
- Line
- Smooth Line
- Pie
- Series Color
- Series Pallet
- Customer ID
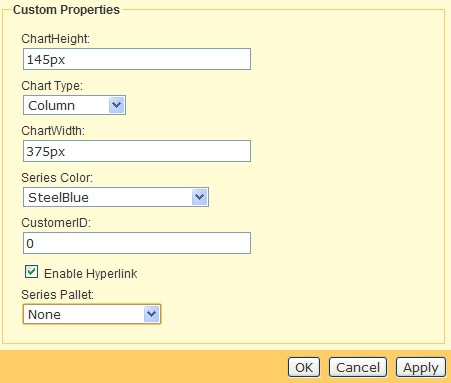
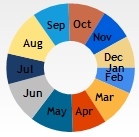
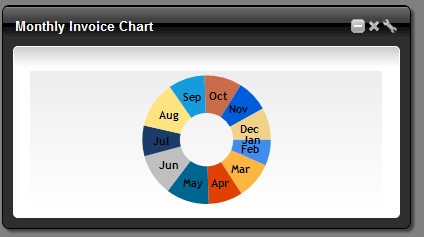
For this demonstration, I am going to just change the Chart Type property from Column to Doghnut. After I select Doghnut from the drop-down listing for Chart Type and click “OK”, the following chart will be displayed instead of the default column chart:
There are many other options and combinations that you can choose. Explore the chart options and see what works best for you!